Site analytics
The Analytics screen shows your site's visitors: how many came, where from, on which device, which pages they looked at, and how many reached you by phone, WhatsApp, form or appointment. You don't need to set anything up on your site; counting starts by itself as soon as your site is live.
Press Analytics in the sidebar.
Choose the period
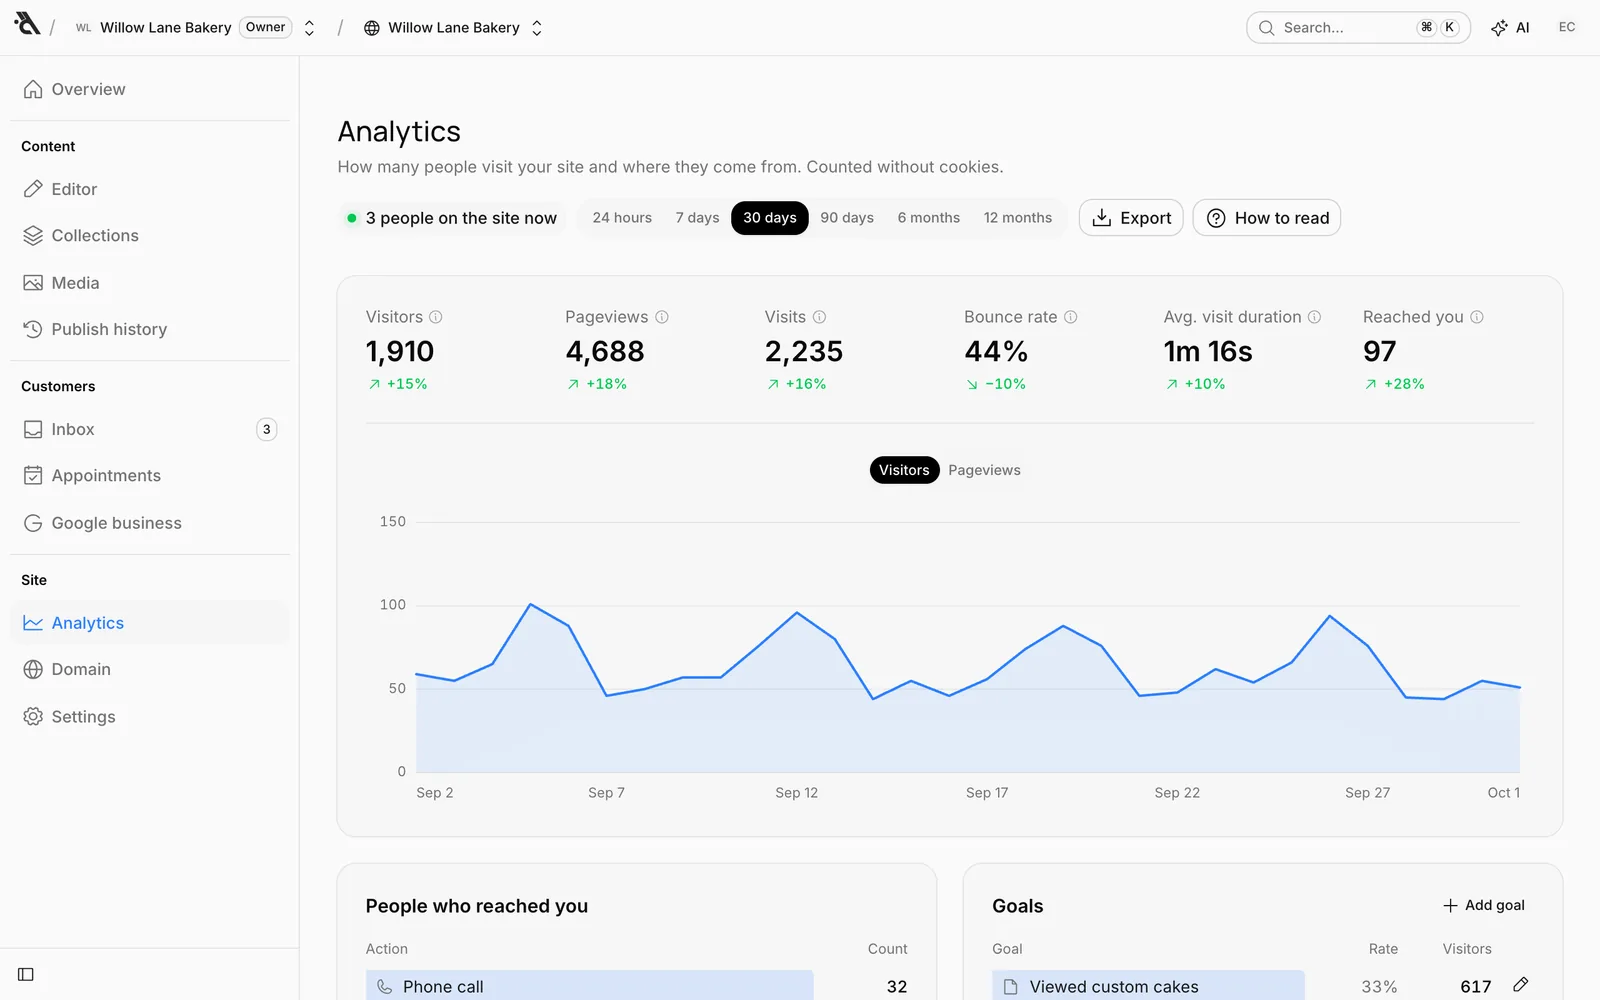
Choose the period in the top right: 24 hours, 7 days, 30 days, 90 days, 6 months or 12 months. Everything on the screen follows this period. The line under the title also says how many people are on your site right now.
Summary numbers
| Number | Meaning |
|---|---|
| Visitors | Different people who visited your site (per day) |
| Pageviews | Pages opened |
| Visits | Times people arrived on the site |
| Bounce rate | Share of visits that saw only one page |
| Avg. visit duration | How long the site stayed on screen during a visit |
| Reached you | People who called, sent a WhatsApp message or an email, got directions, filled in the form or requested an appointment |
Each number shows the change from the previous period; green is the good direction, red the bad one. The chart below shows visitors day by day; use the switch above the chart to show pageviews instead.
People who reached you, and goals
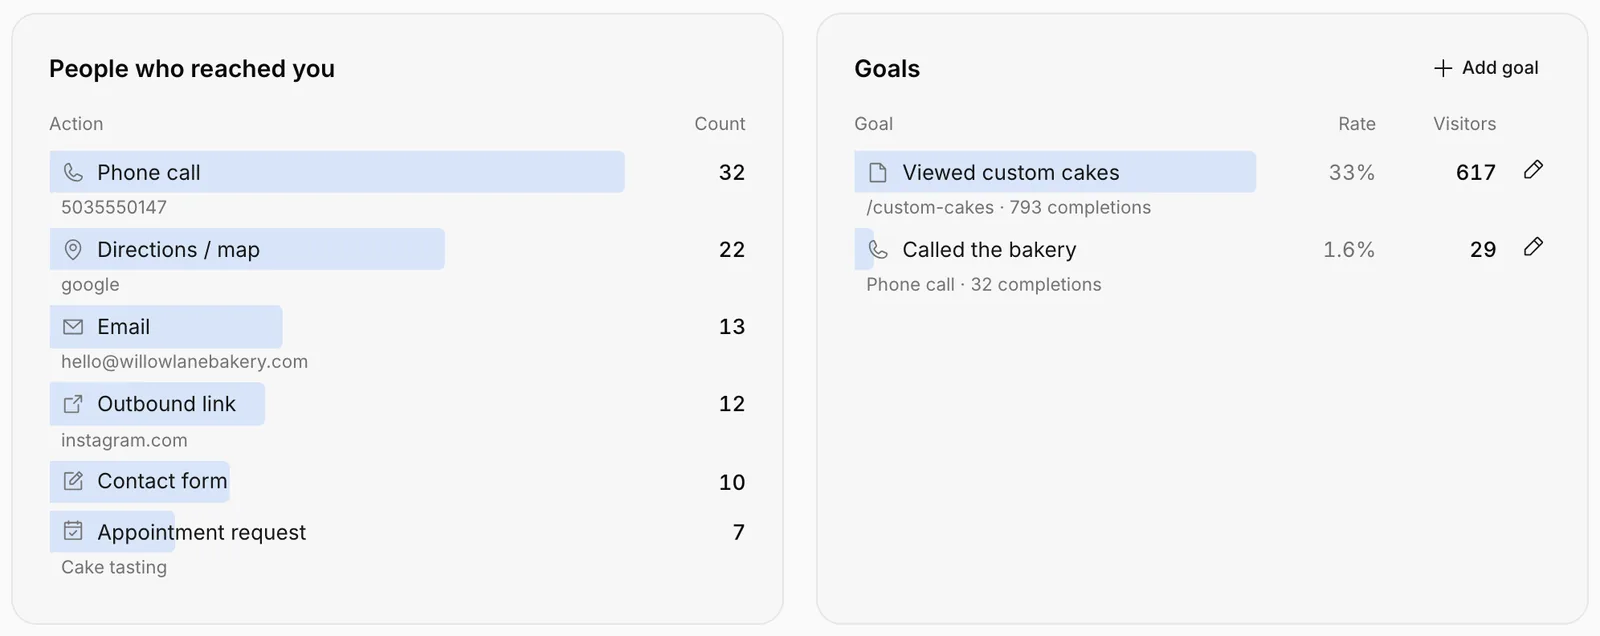
The People who reached you card lists how visitors got in touch: Phone call, WhatsApp, Email, Directions / map, Contact form, Appointment request, Outbound link.
Add a goal
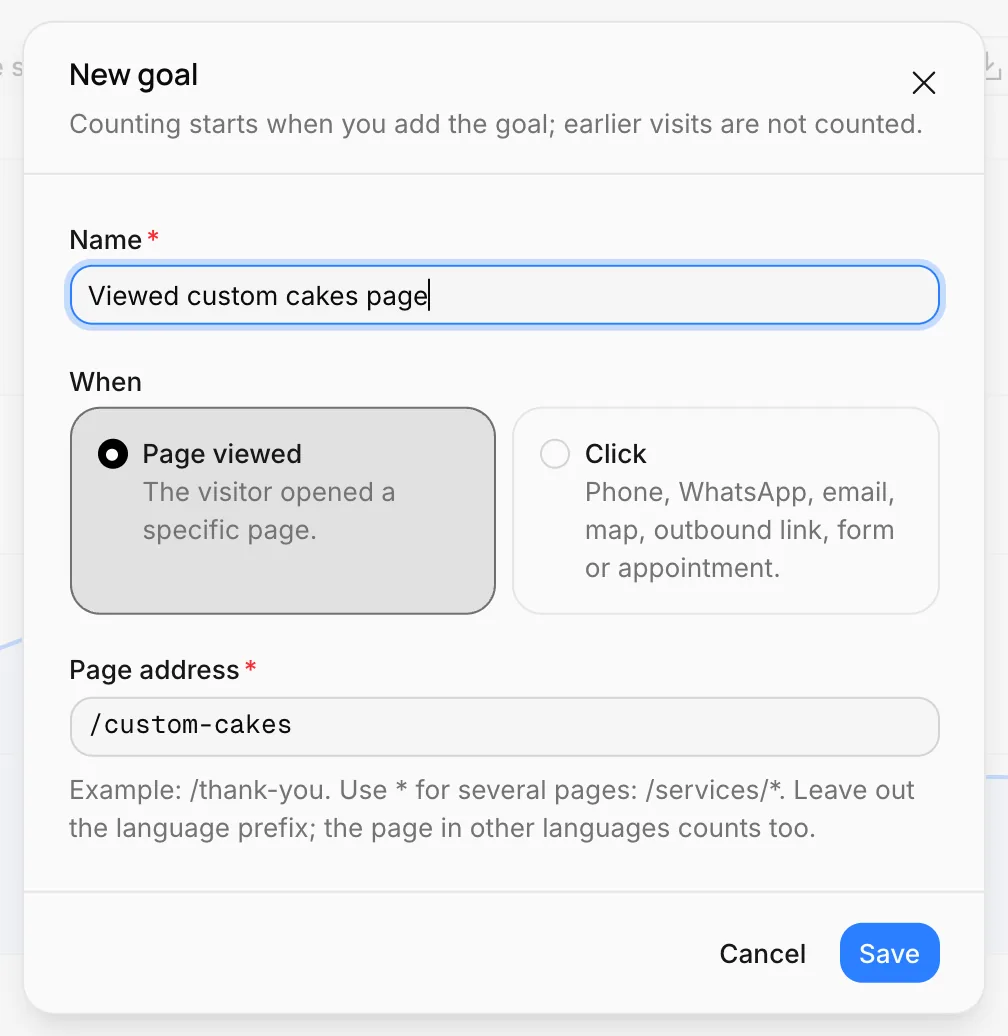
A goal is a visitor doing something that matters to you: viewing your custom cakes page, clicking through to your online shop, calling a particular number. On the Goals card, press Add goal:
- Name: What you call the goal ("Viewed custom cakes page").
- When: Page viewed or Click.
- Page address: For example
/custom-cakes. Use*for several pages:/our-bakes/*. The page's versions in other languages count too. - Click type and Target contains: For example, to count only calls to a particular number, type the number.
For each goal, the card shows how many people completed it, how many times it was completed and what share of visitors that is.
Where they came from, and which pages they viewed
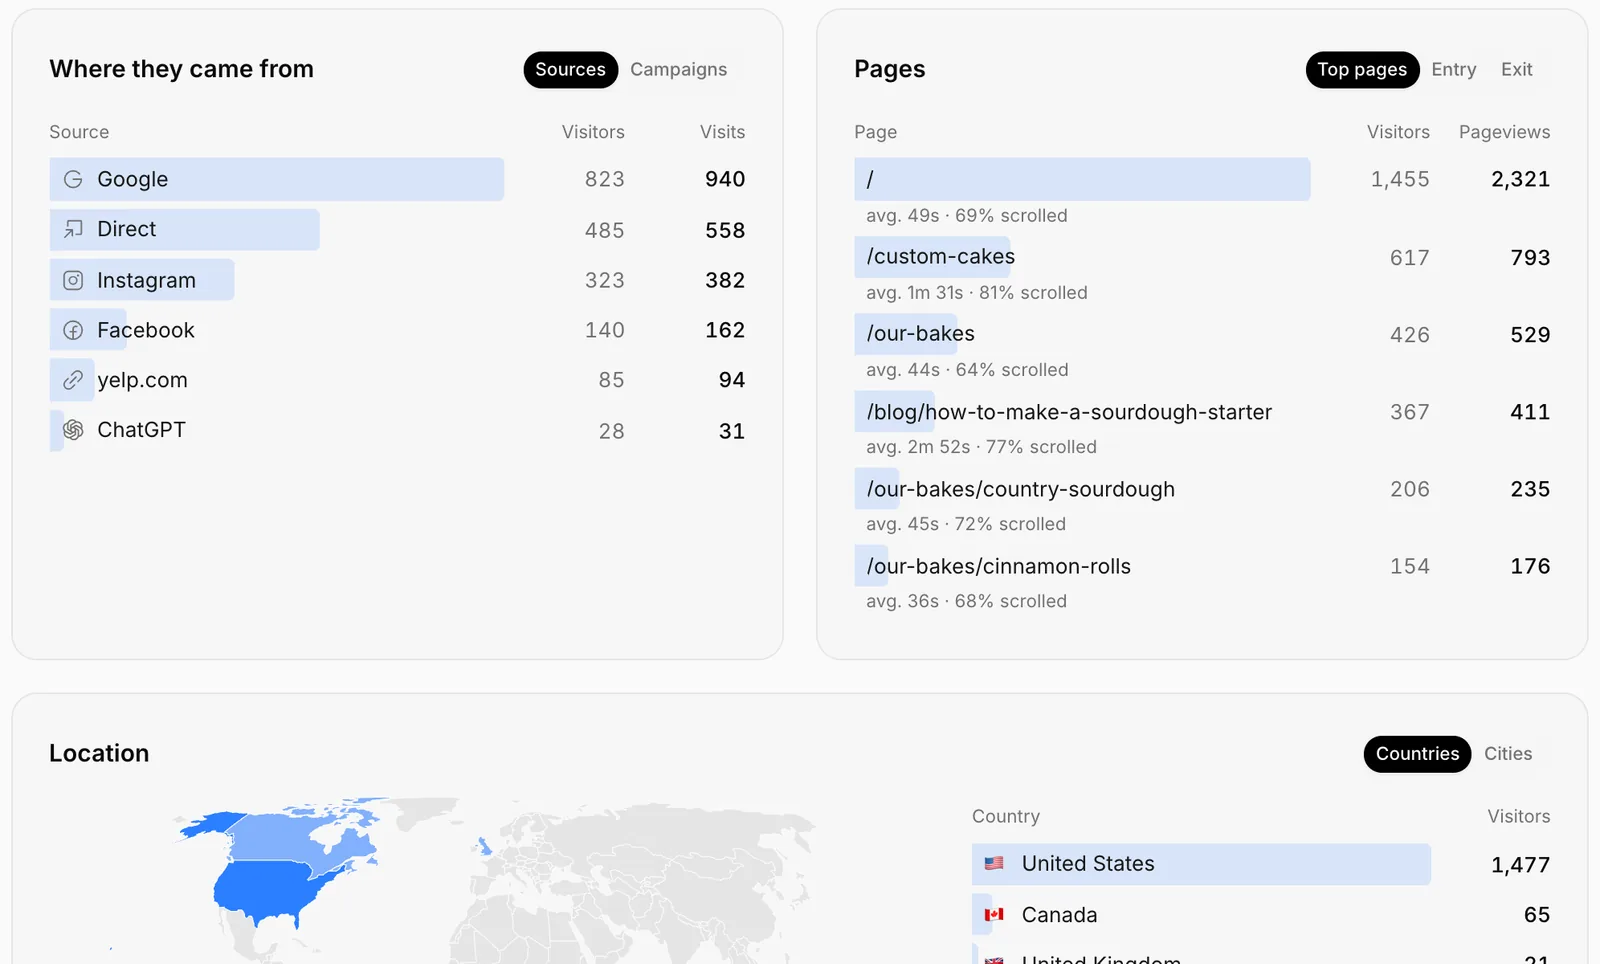
- Where they came from: Where visitors came from: Google, Instagram, Facebook, other sites, or Direct (typing the address, a bookmark or an app). The Campaigns tab lists visits from UTM-tagged links.
- Pages: Top pages, and the pages where visits started (Entry) and ended (Exit). Under each page you see the average time spent and how far down it was scrolled.
?utm_source=instagram&utm_campaign=spring), you'll see how many people came from that campaign separately on the Campaigns tab.Location
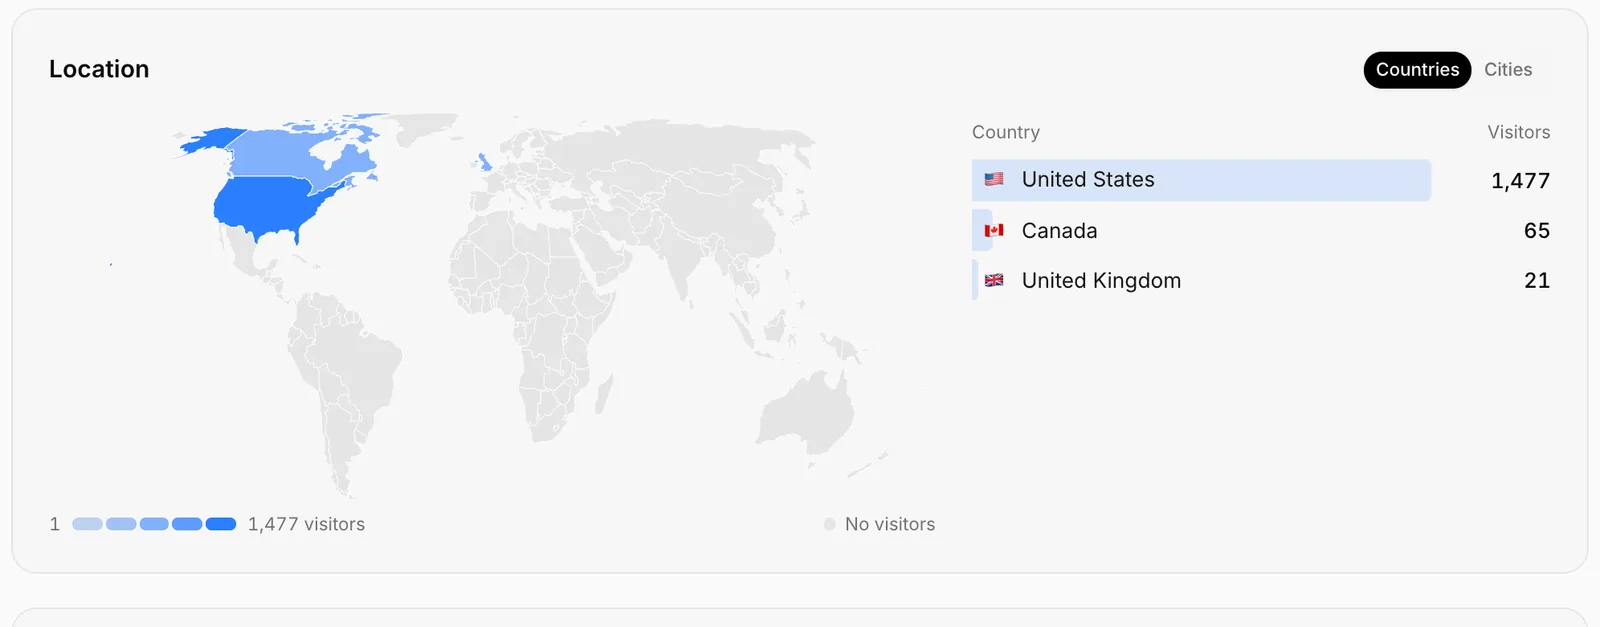
The countries your visitors come from are shown on a world map and in a list. The Cities tab lists them city by city. Hover over a country on the map to see its number.
Devices
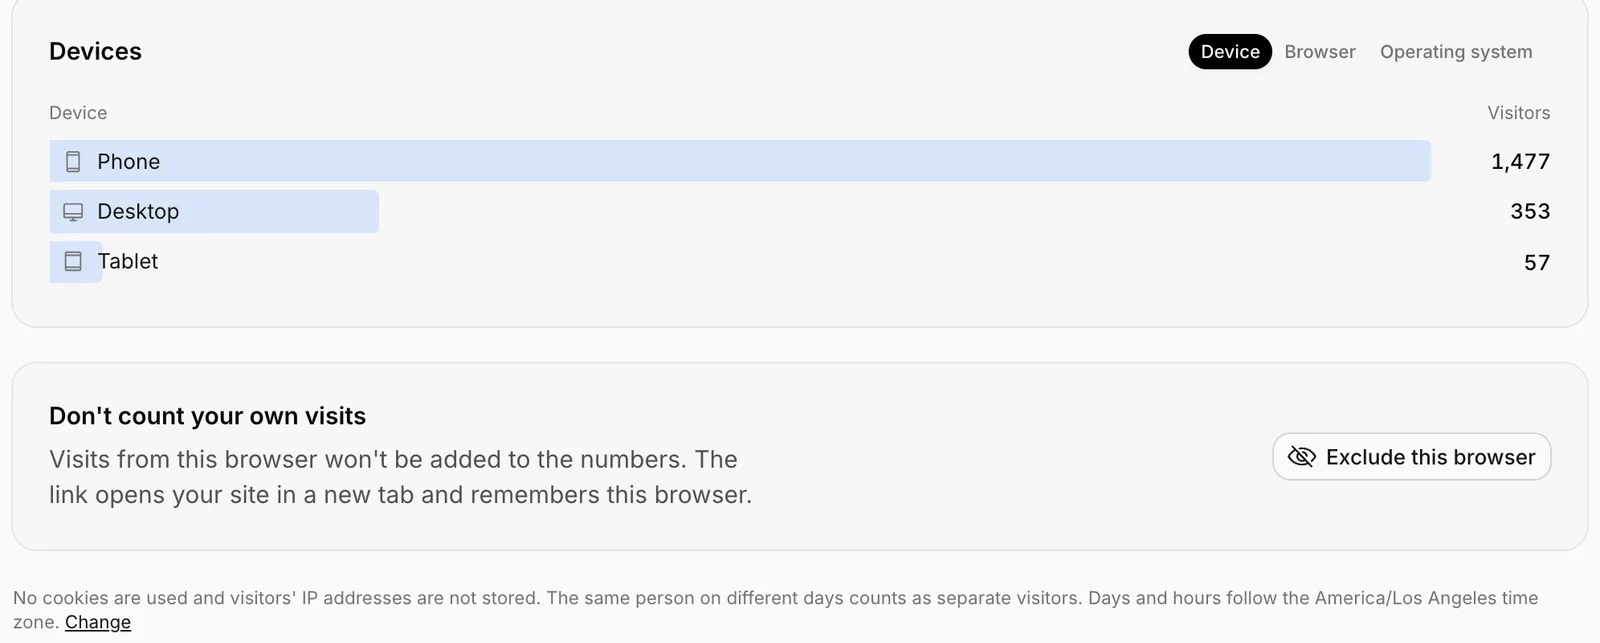
Whether visitors came on a Phone, Tablet or Desktop; the other tabs show the browser and operating system.
Don't count your own visits
If you check your site often, your own visits inflate the numbers. On the Don't count your own visits card at the bottom of the screen, press Exclude this browser. Your site opens in a new tab, and visits from that browser stop being counted. Do the same on your other devices, like your phone.
Previews you open while working in the editor are never counted.
Export
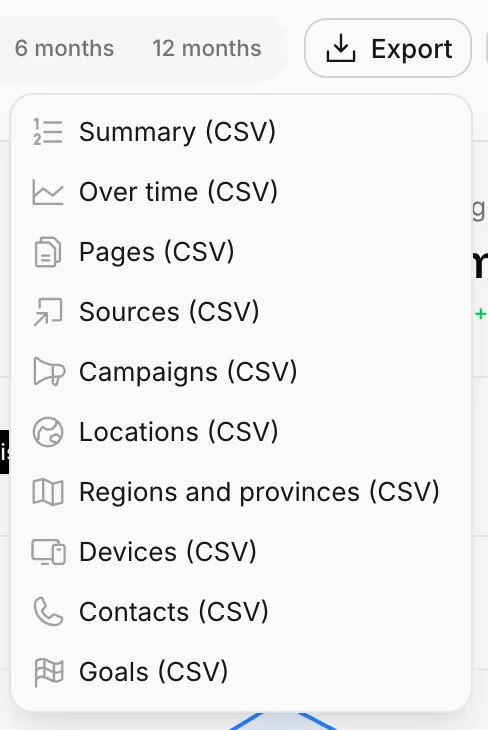
From the Export menu in the top right, you can download each table as a separate CSV file: summary, over time, pages, sources, locations, devices, people who reached you, goals. CSV files open in Excel or Google Sheets.
How to read
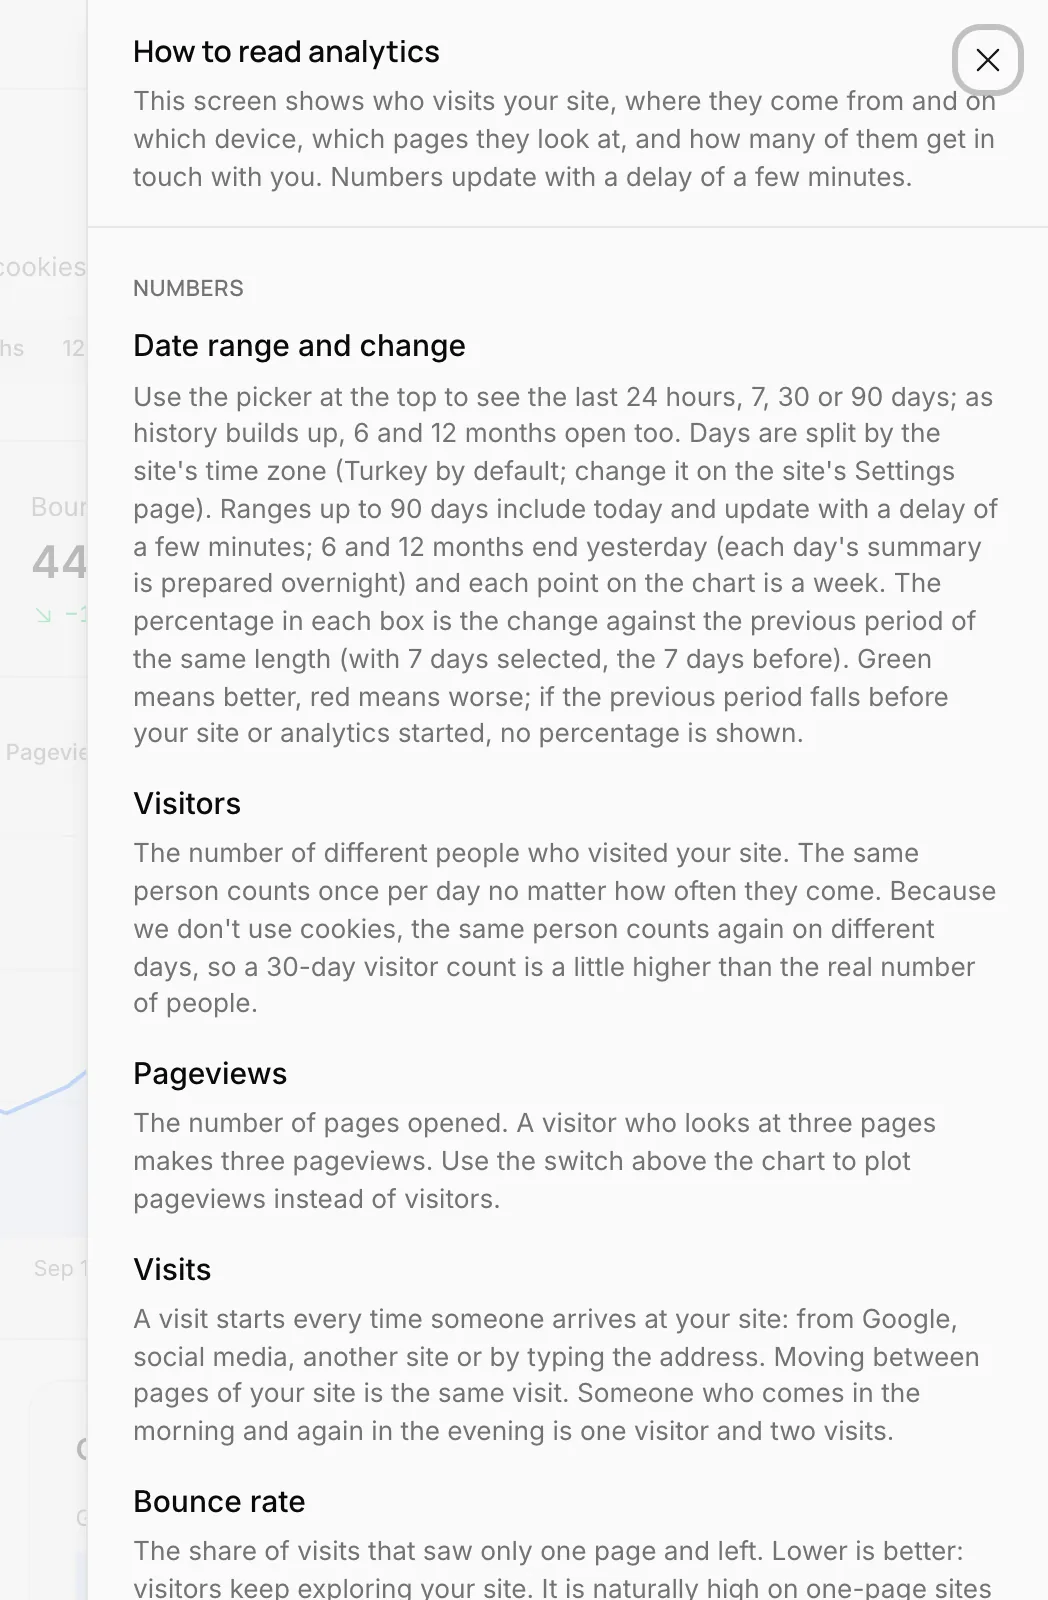
The How to read button opens an explanation of what each number means and what isn't counted.
Weekly report and the assistant
- The organization's owner gets a summary of the previous week by email every Monday: how many people visited, how many reached you, where most came from. You can turn the report off in Organization settings. No email is sent for sites with no visitors that week.
- You can ask the assistant too: "How did my site do this month?", "Which page isn't doing well?" The assistant reads the numbers on this screen and explains them, and can fix the page if you want.
Good to know
- Days are counted in your site's time zone; change it in Site settings.
- Bots and automated tools aren't counted.
- In the 6 months and 12 months views, the chart is weekly.
Overview
Your site's status, the messages and appointments waiting for you, the last 7 days of visitors, the setup list and your site's QR code, all on one screen.
Connect your own domain
Publish your site on your own domain, like willowlanebakery.com; add the DNS records, follow the status and use more than one domain.